Temperature Statistics
15/07/25 21:30:00 GMT
24 hour Temperature Plot
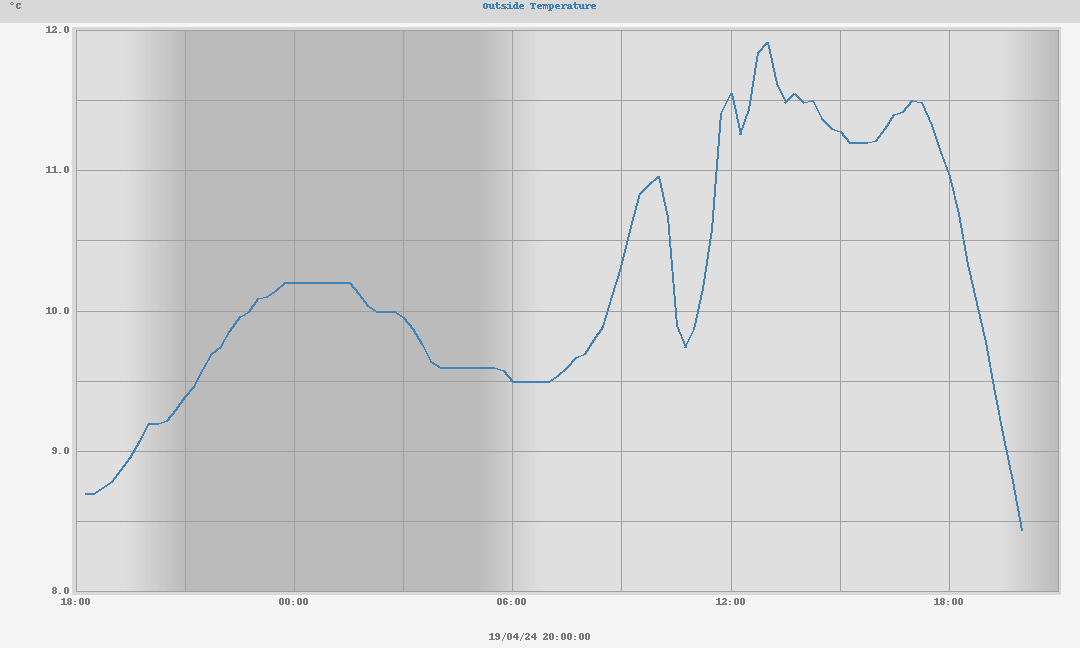
24 hour Temperature
| Current Temperature | 15.9°C |
| Temperature Trend (Last hour) | -0.5°C |
| Temperature Trend (3 hours) | -2.1°C |
| High Temperature (24hr) | 18.8°C at 10:07:46 |
| Low Temperature (24hr) | 13.1°C at 04:45:00 |
Temperature (48hrs)
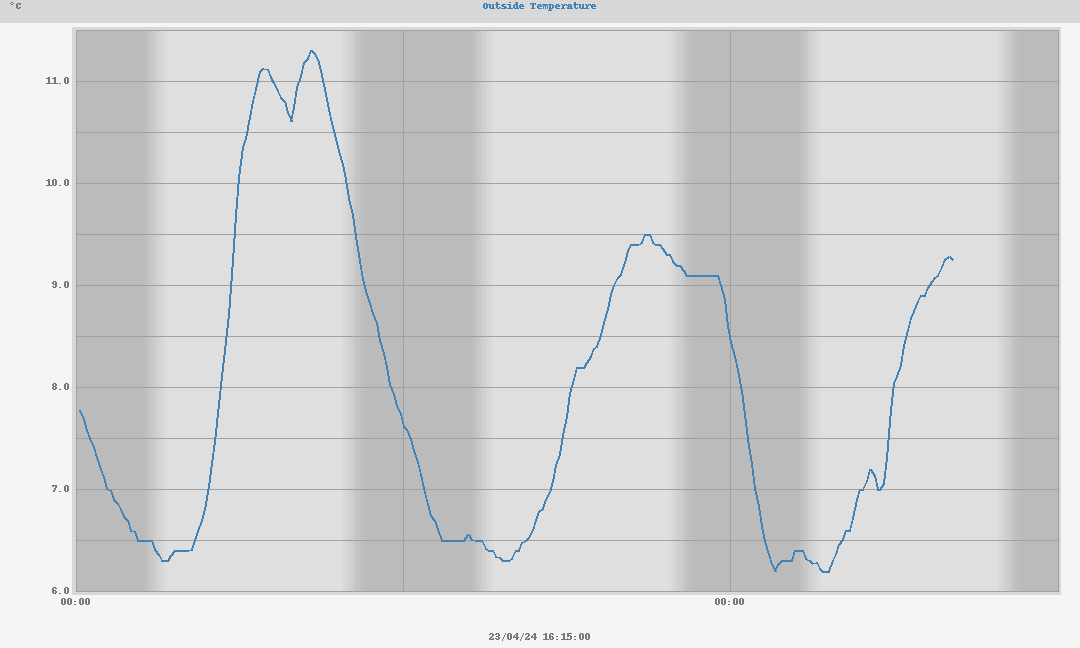
48 hour Temperature
| High Temperature (48hr) | 26.0°C at 13:00:00 |
| Low Temperature (48hr) | 13.1°C at 04:45:00 |
Weekly Temperature Plots
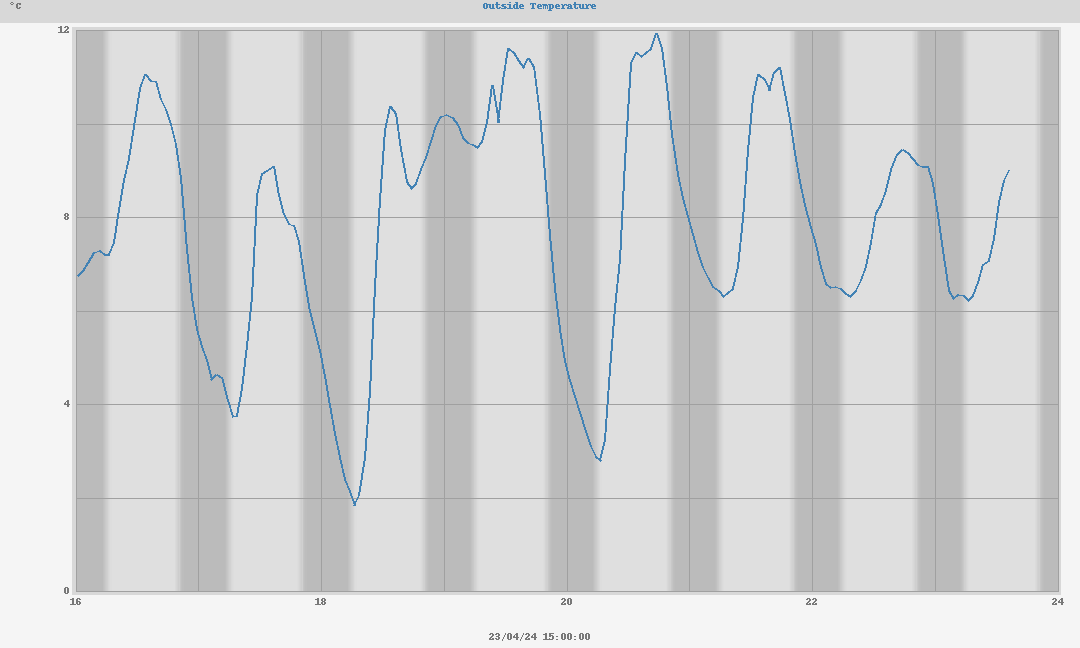
Weekly Stats
| Weekly High | 26.1°C at 12:53:44 (Monday) |
| Weekly Low | 13.1°C at 04:45:00 (Tuesday) |
Monthly Temperature plots
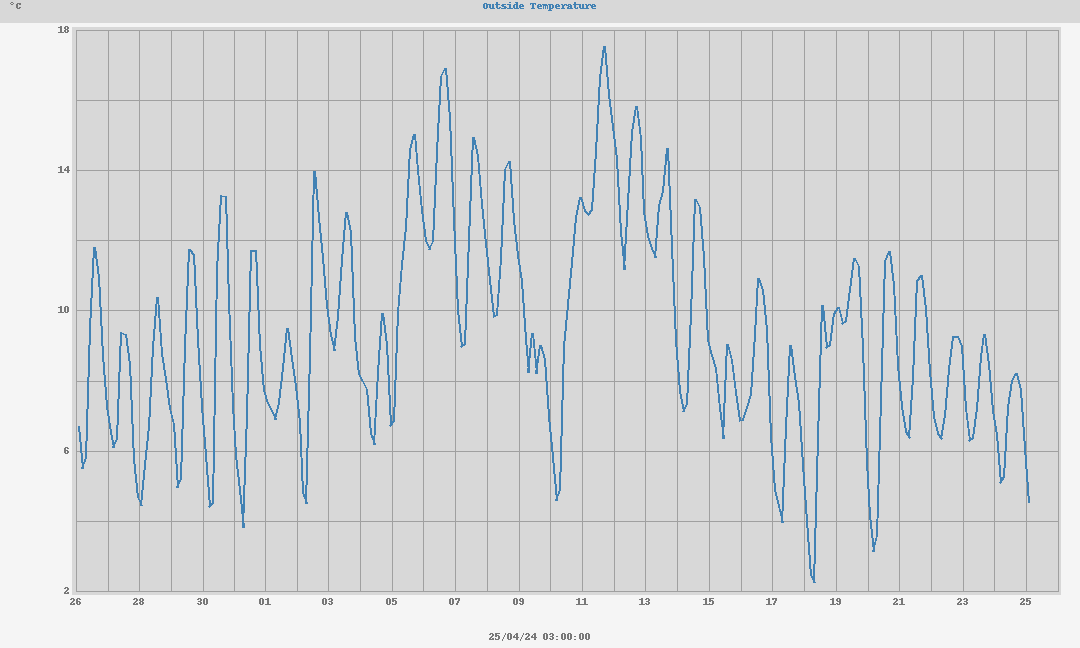
Monthly Stats
| Monthly High | 32.0°C at 11/07/25 12:55:45 |
| Monthly Low | 10.7°C at 08/07/25 02:23:41 |
Yearly Temperature plots
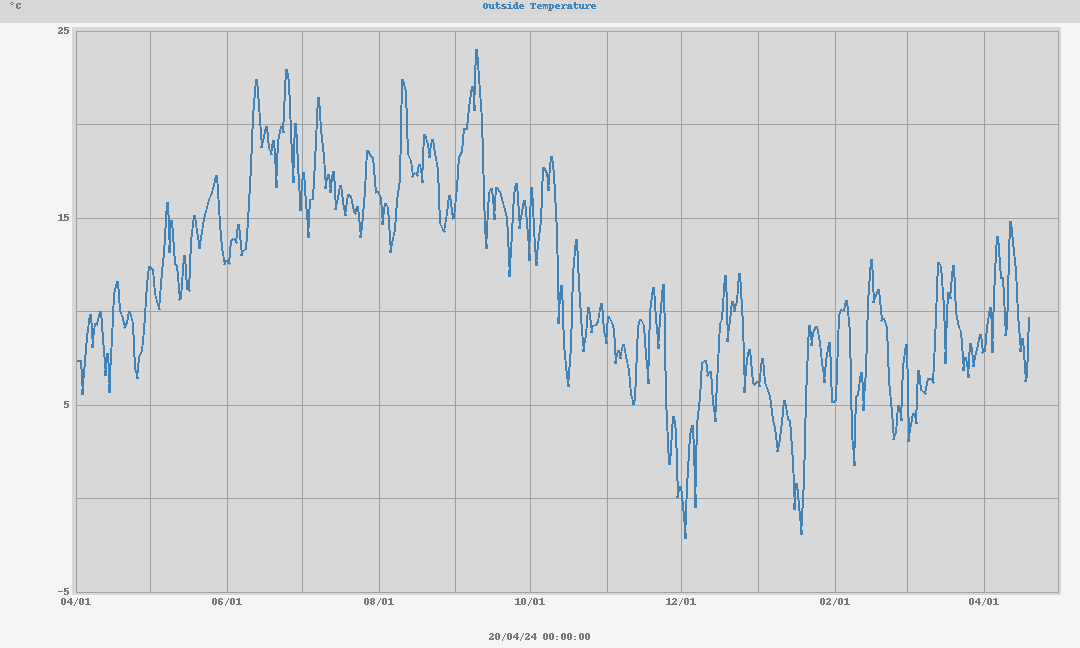
Yearly Stats
| Yearly High | 32.6°C at 30/06/25 17:43:38 |
| Yearly Low | -5.5°C at 11/01/25 08:45:00 |
High and Low Temperature records
| Month | Min | Max |
| January | -5.5°C | 10.4°C |
| February | -2.8°C | 15.6°C |
| March | -2.0°C | 19.0°C |
| April | 0.6°C | 26.5°C |
| May | 2.7°C | 27.6°C |
| June | 8.5°C | 32.6°C |
| July | 10.7°C | 32.0°C |
| August | N/A | N/A |
| September | N/A | N/A |
| October | N/A | N/A |
| November | N/A | N/A |
| December | N/A | N/A |