Pressure Statistics
02/05/26 13:15:00 GMT
Pressure plots
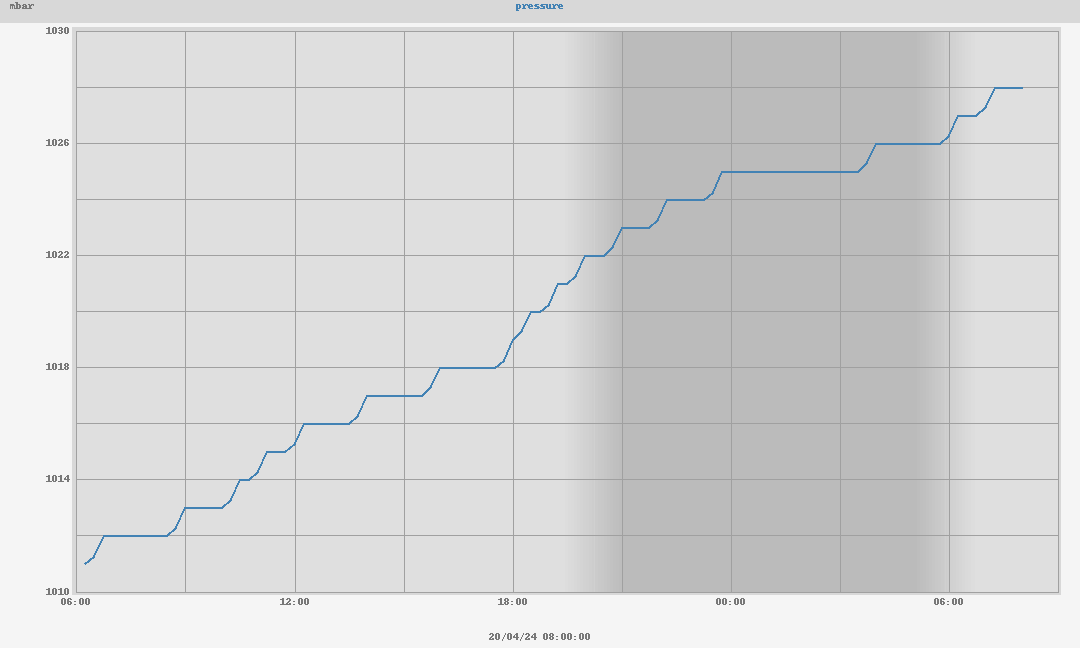
24 hours pressure plot
Pressure Details
| Current Pressure | 1014.0 mbar |
| Barometer Trend (3 hours) | -1.0 mbar |
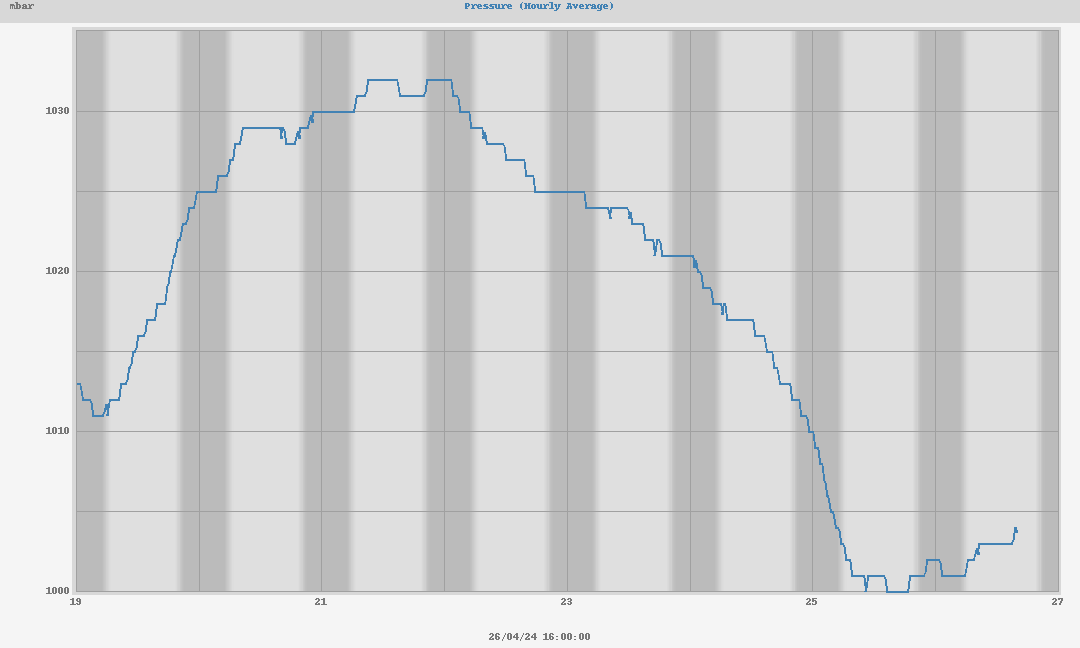
Weekly pressure plots
Weekly Stats
| Weekly High | 1030.0 mbar at 21:39:09 (Tuesday) |
| Weekly Low | 1014.0 mbar at 11:53:55 (Saturday) |
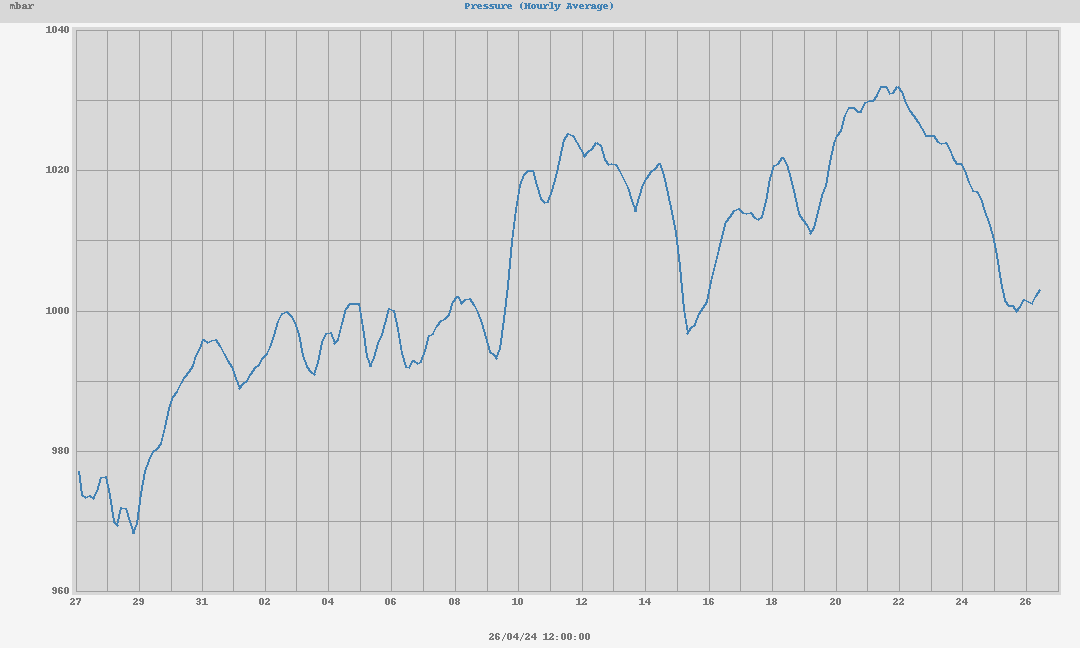
Monthly pressure plots
Monthly Stats
| Monthly High | 1022.0 mbar at 01/05/26 00:00:15 |
| Monthly Low | 1014.0 mbar at 02/05/26 11:53:55 |
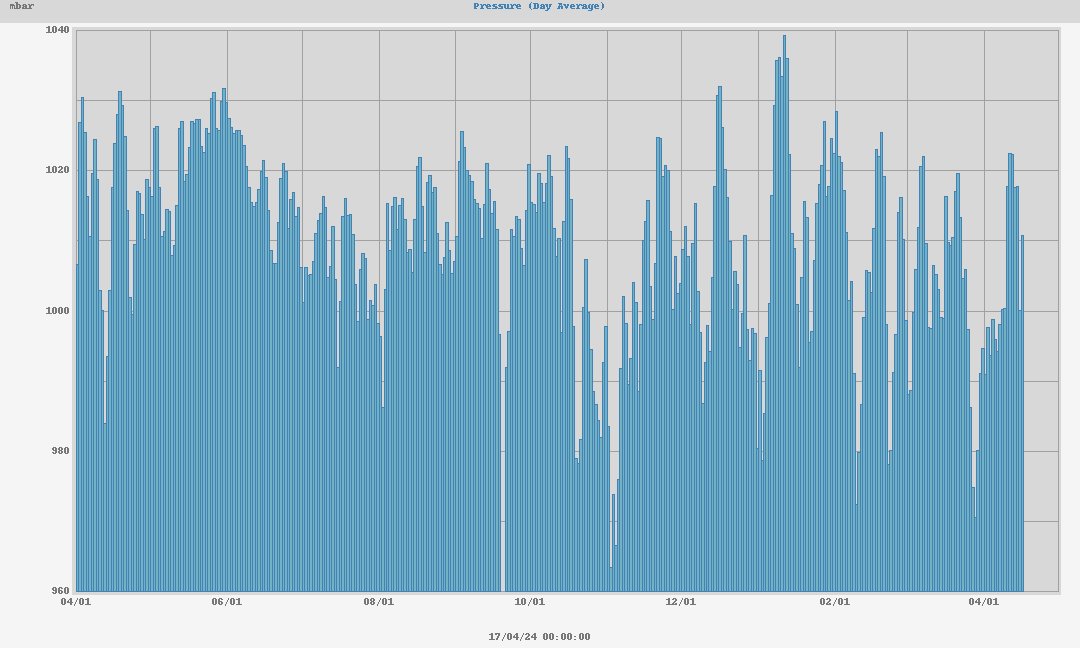
Yearly pressure plots
Yearly Stats
| Yearly High | 1034.0 mbar at 23/04/26 09:08:57 |
| Yearly Low | 973.0 mbar at 11/02/26 17:00:00 |